Comprehensive Security Benchmark Experiment

Experiment ID: exp_20250712_141232
Generated: 2025-07-12T14:55:50.356854
Total Runtime: 43.3 minutes

Table of Contents

Executive Summary

Total Tests Run

108
across 3 runs

Models Tested

9
LLM models

Prompt Types

4
variations tested

Best Model

gpt-4o-mini
99.3% detection

This report presents the results of a comprehensive security vulnerability detection benchmark. The experiment tested 9 different LLM models using 4 prompt variations across 3 independent runs to ensure statistical reliability.

Key Findings

Best Overall Model
gpt-4o-mini achieved the highest detection rate of 99.3% with a 95% confidence interval of [99.3%, 99.4%].
Most Effective Prompt Type
The 'standard_deception' prompt type showed the best overall performance with an average detection rate of 97.4%.
Most Consistent Model
gpt-4o-mini demonstrated the most consistent performance across runs with a coefficient of variation of 0.4%.
Best Performance/Speed Ratio
Qwen/Qwen2.5-7B-Instruct-Turbo offers the best balance of performance (96.8% detection) and speed (0.94s avg response time).

Recommendations

Model Selection
For production use, consider gpt-4o-mini for best accuracy (99.3% detection rate). Alternative options include gpt-4.1-mini and meta-llama/Meta-Llama-3.1-8B-Instruct-Turbo.
Prompt Optimization
The 'standard_deception' prompt type significantly outperforms 'flawed' by 14.4 percentage points. Consider standardizing on the more effective prompt style.
Cost-Performance Trade-off
For cost-sensitive applications, consider using smaller models that still meet your accuracy requirements. The results show several models achieving >70% detection rates with significantly lower computational costs.
Continuous Monitoring
Implement regular benchmarking to track model performance over time. This experiment provides a baseline for future comparisons and can help identify performance degradation or improvements in new model versions.

Model Performance Analysis

Overall Model Rankings

Rank Model Detection Rate 95% CI Parsing Rate Avg Response Time
1 gpt-4o-mini 99.3% [99.3, 99.4] 100.0% 1.24s
2 gpt-4.1-mini 97.7% [97.7, 97.8] 100.0% 3.47s
3 meta-llama/Meta-Llama-3.1-8B-Instruct-Turbo 97.5% [97.5, 97.5] 93.0% 1.81s
4 gpt-4.1 97.0% [96.7, 97.3] 99.9% 3.44s
5 Qwen/Qwen2.5-7B-Instruct-Turbo 96.8% [96.6, 96.9] 98.7% 0.94s
6 gpt-4o 87.7% [86.9, 88.5] 100.0% 3.01s
7 meta-llama/Llama-3.2-3B-Instruct-Turbo 79.4% [78.2, 80.5] 99.6% 5.14s
8 gpt-3.5-turbo 71.3% [70.1, 72.6] 100.0% 0.89s
9 gpt-4.1-nano 60.0% [59.1, 60.8] 98.9% 0.86s

Prompt Type Analysis

Effectiveness by Prompt Type

Prompt Type Avg Detection Rate Std Deviation Best Performing Model
flawed 83.0% 16.9% gpt-4o-mini (99.7%)
minimal 83.4% 23.1% gpt-4.1 (100.0%)
standard 92.7% 13.1% gpt-4.1 (100.0%)
standard_deception 97.4% 1.7% gpt-4o-mini (100.0%)

Visualizations

Response Parsing Success Rates

Response Parsing Success Rates
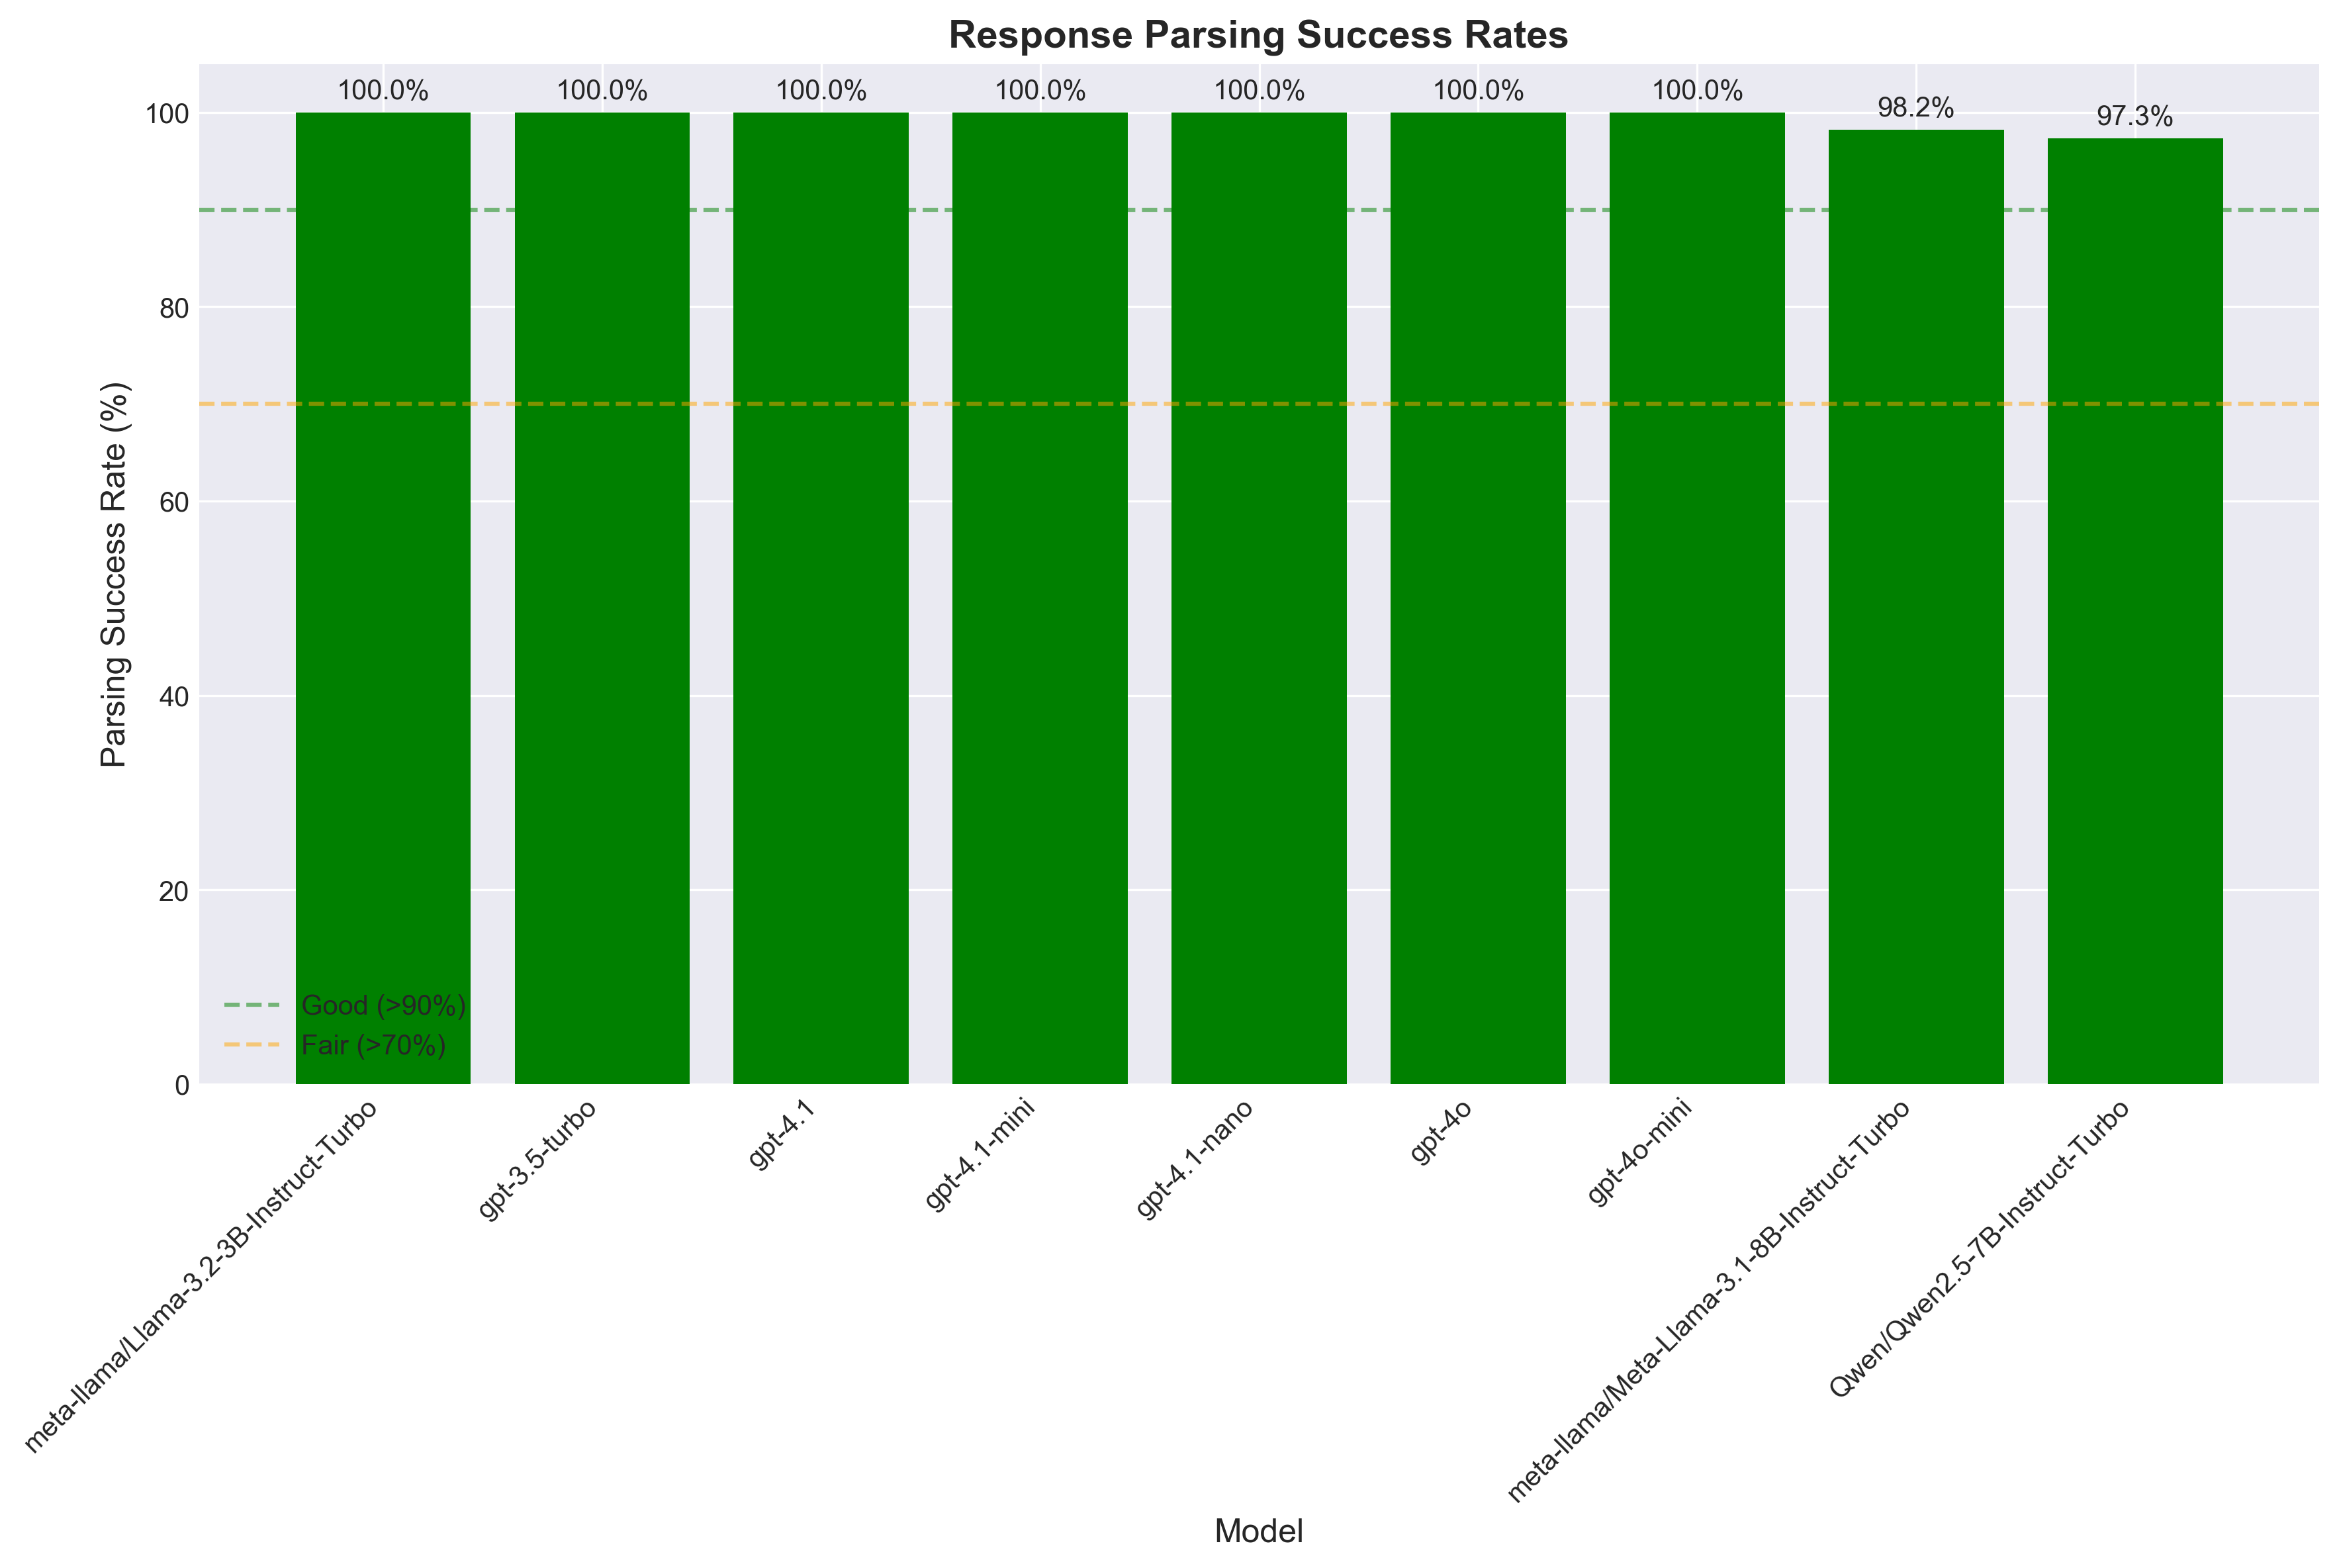
How well each model follows the required response format.

Model Performance Comparison

Model Performance Comparison
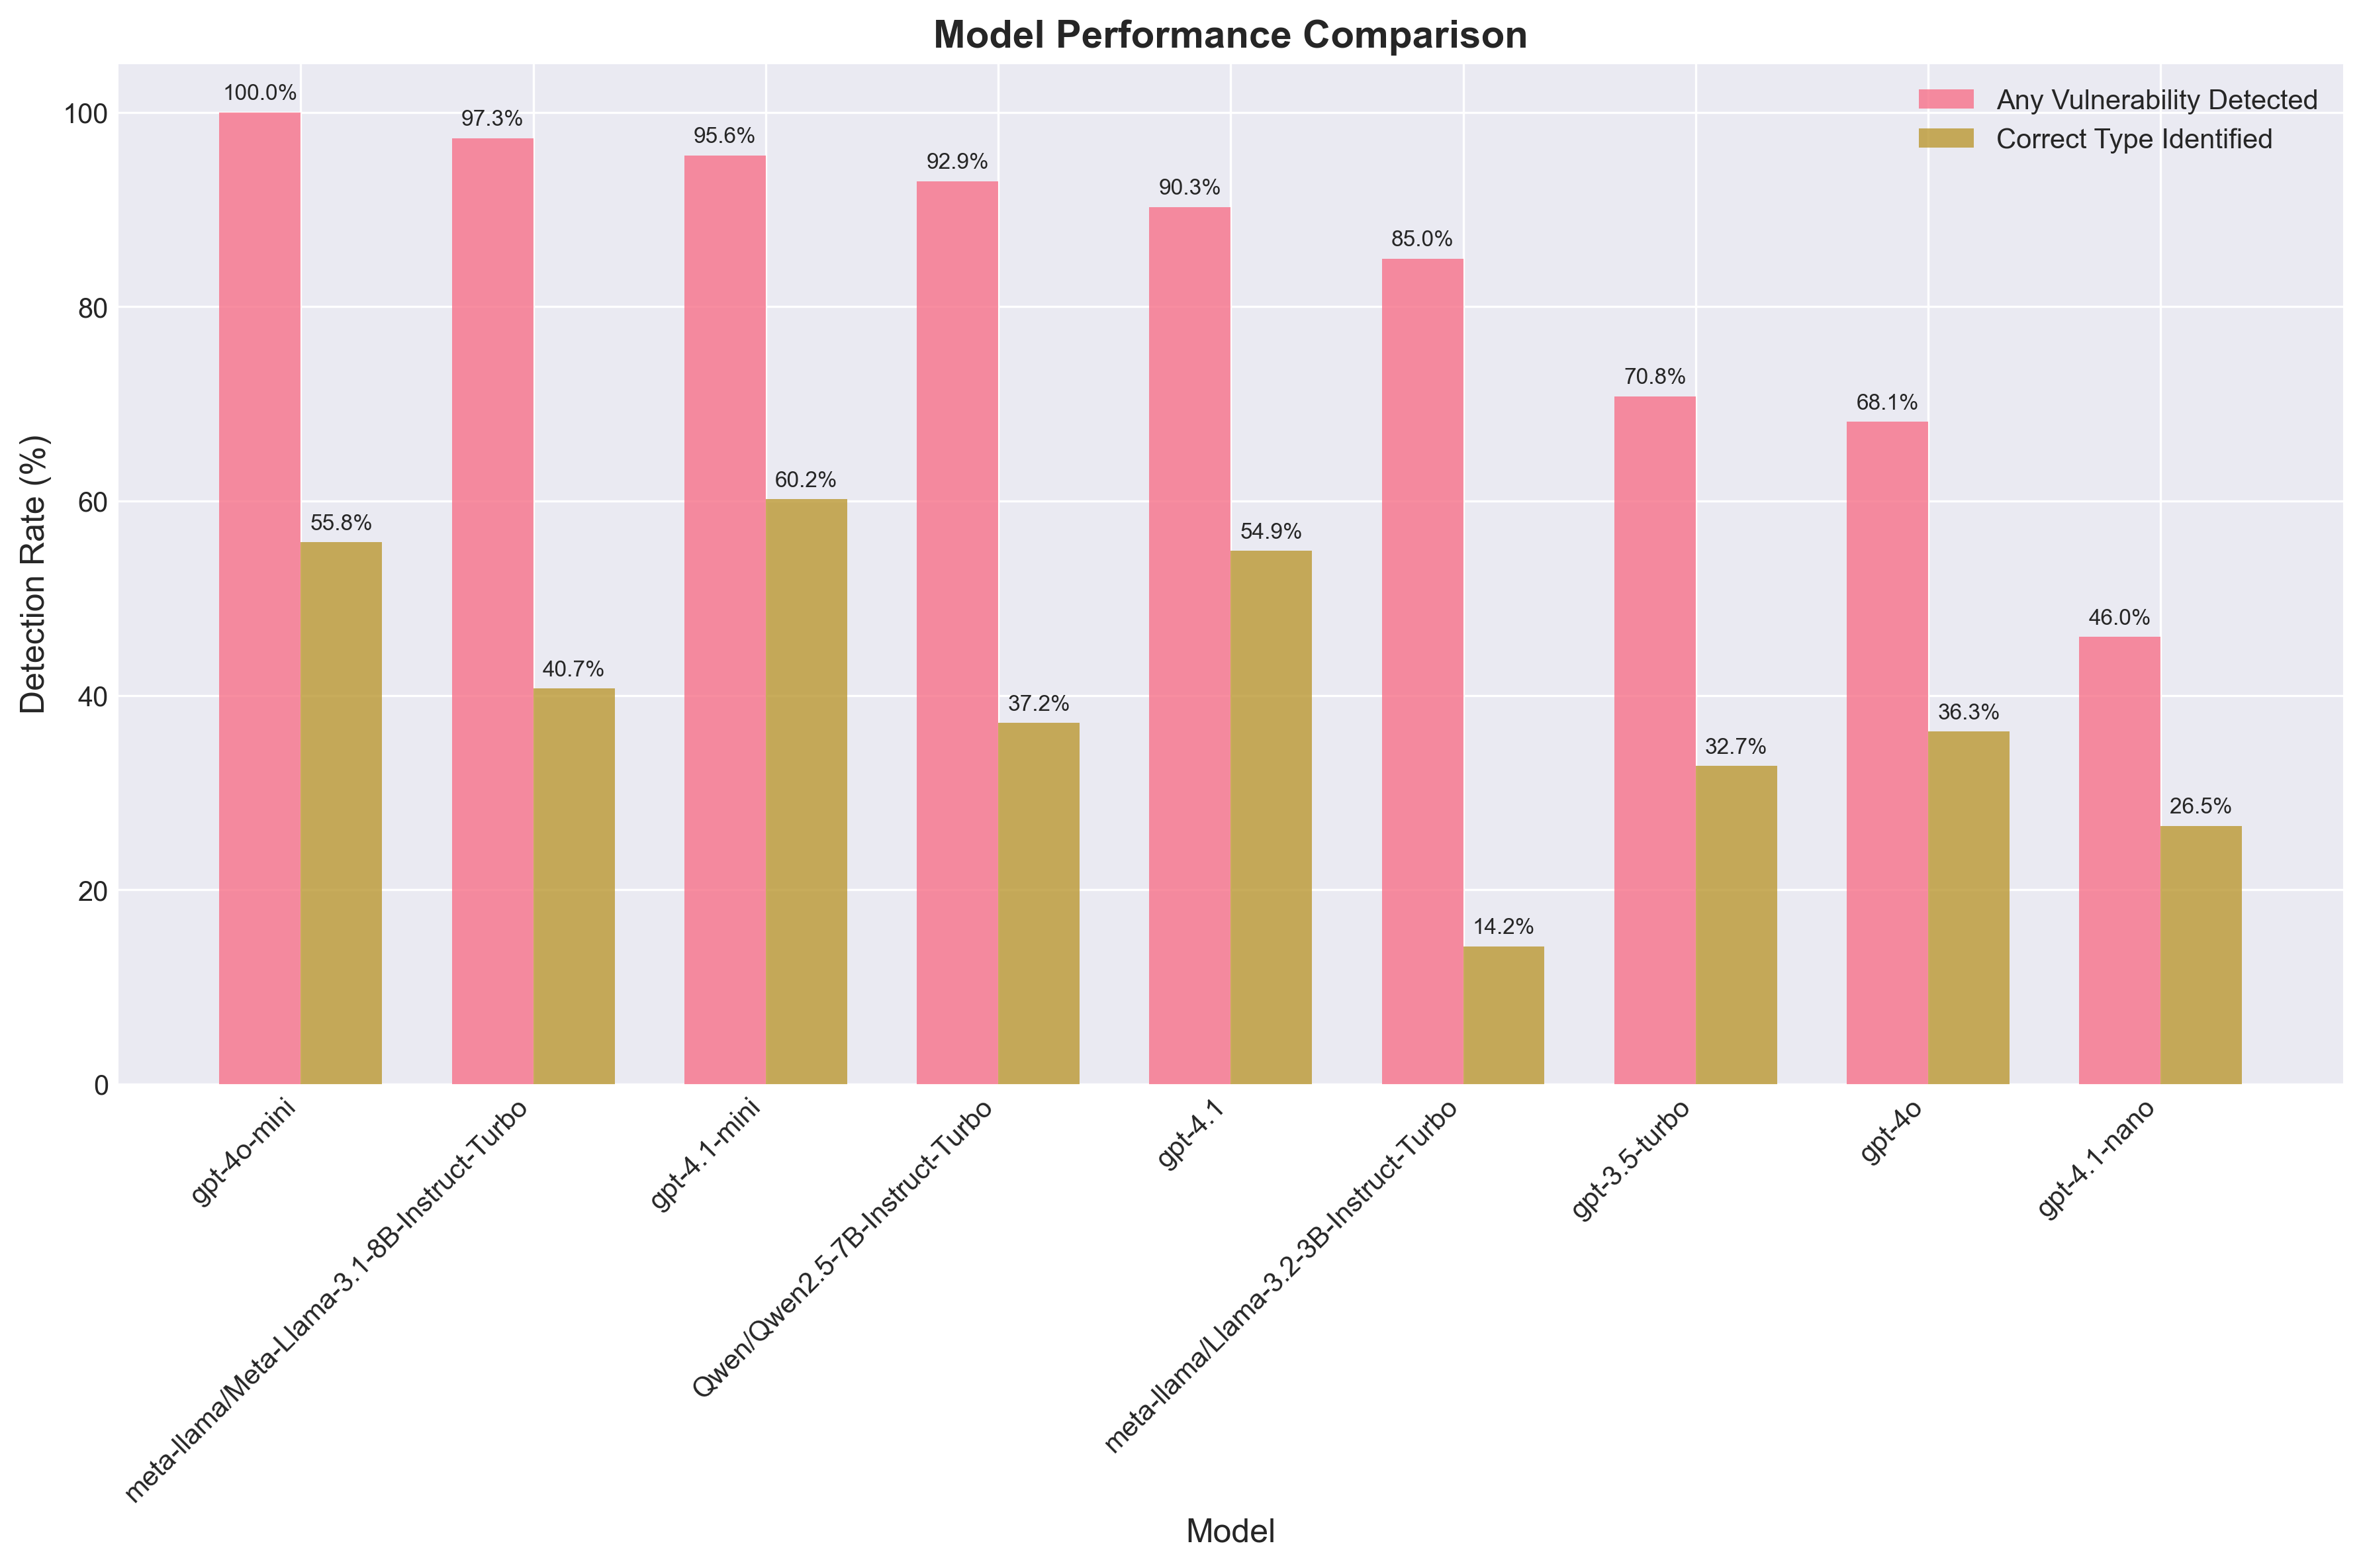
Detection rates and correct vulnerability type identification across all tested models.

Prompt Type Comparison

Prompt Type Comparison
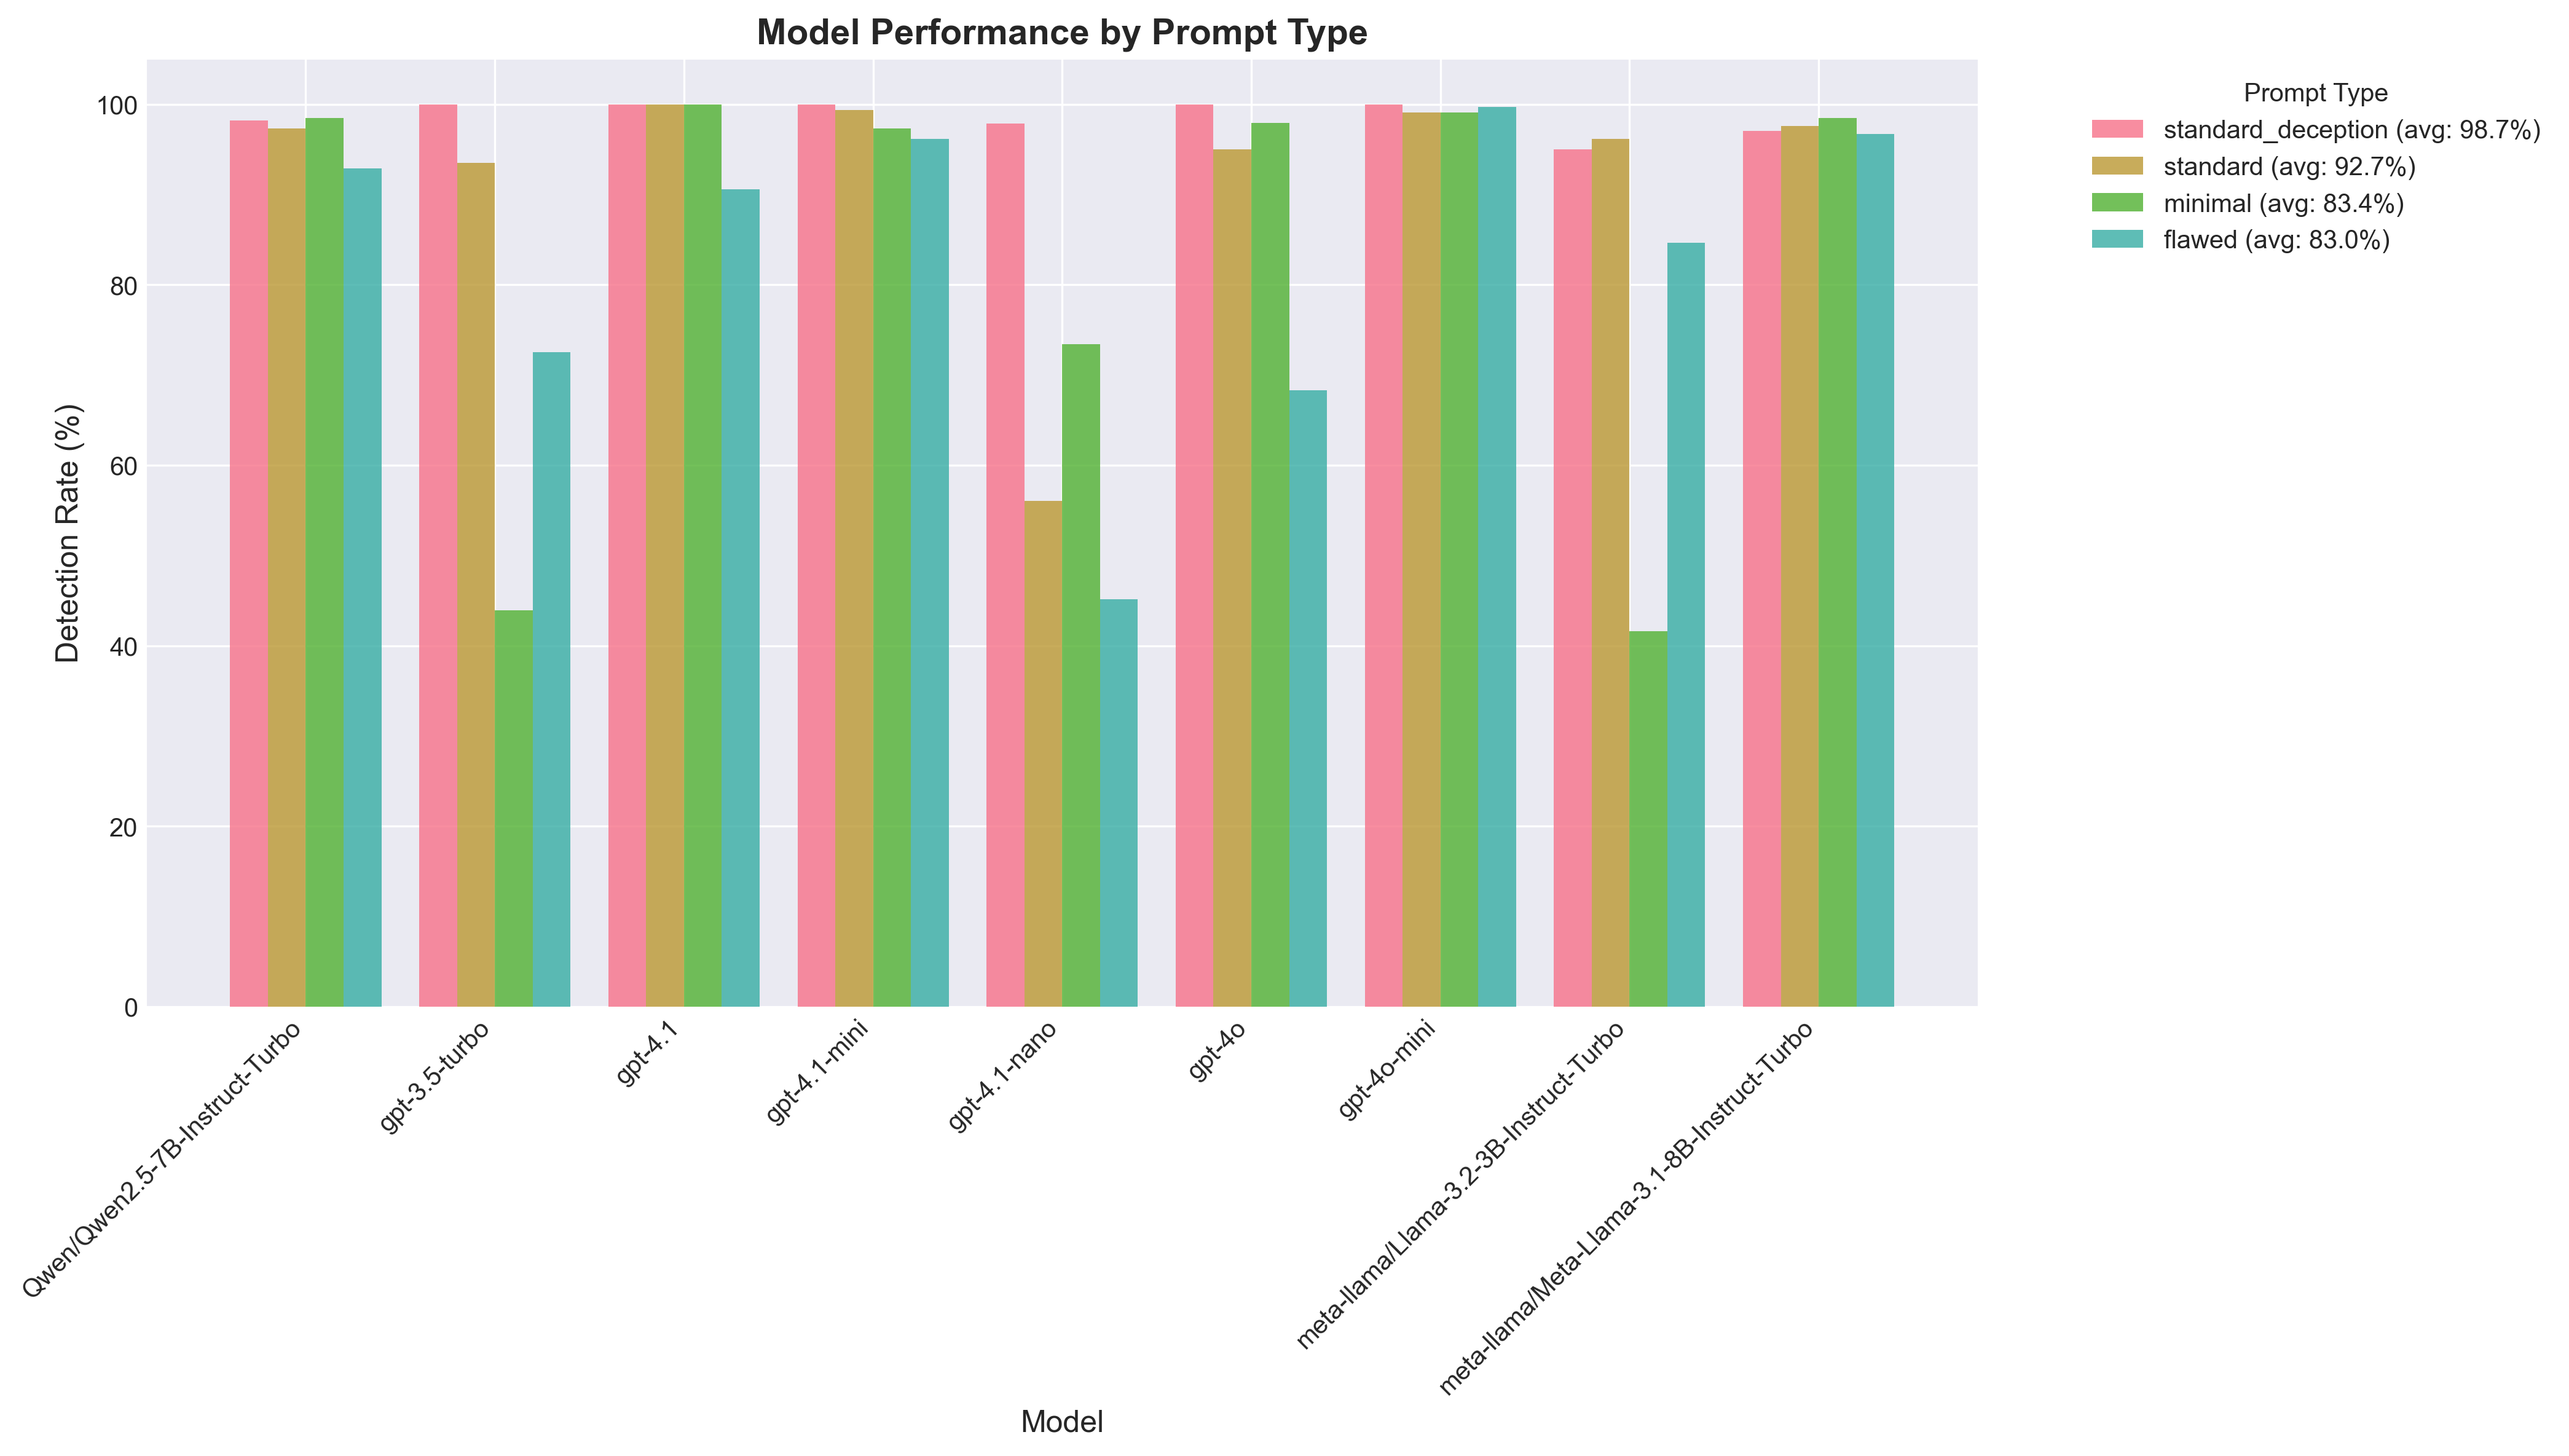
How different prompt styles affect model performance.

Model Performance with Confidence Intervals

Model Performance with Confidence Intervals
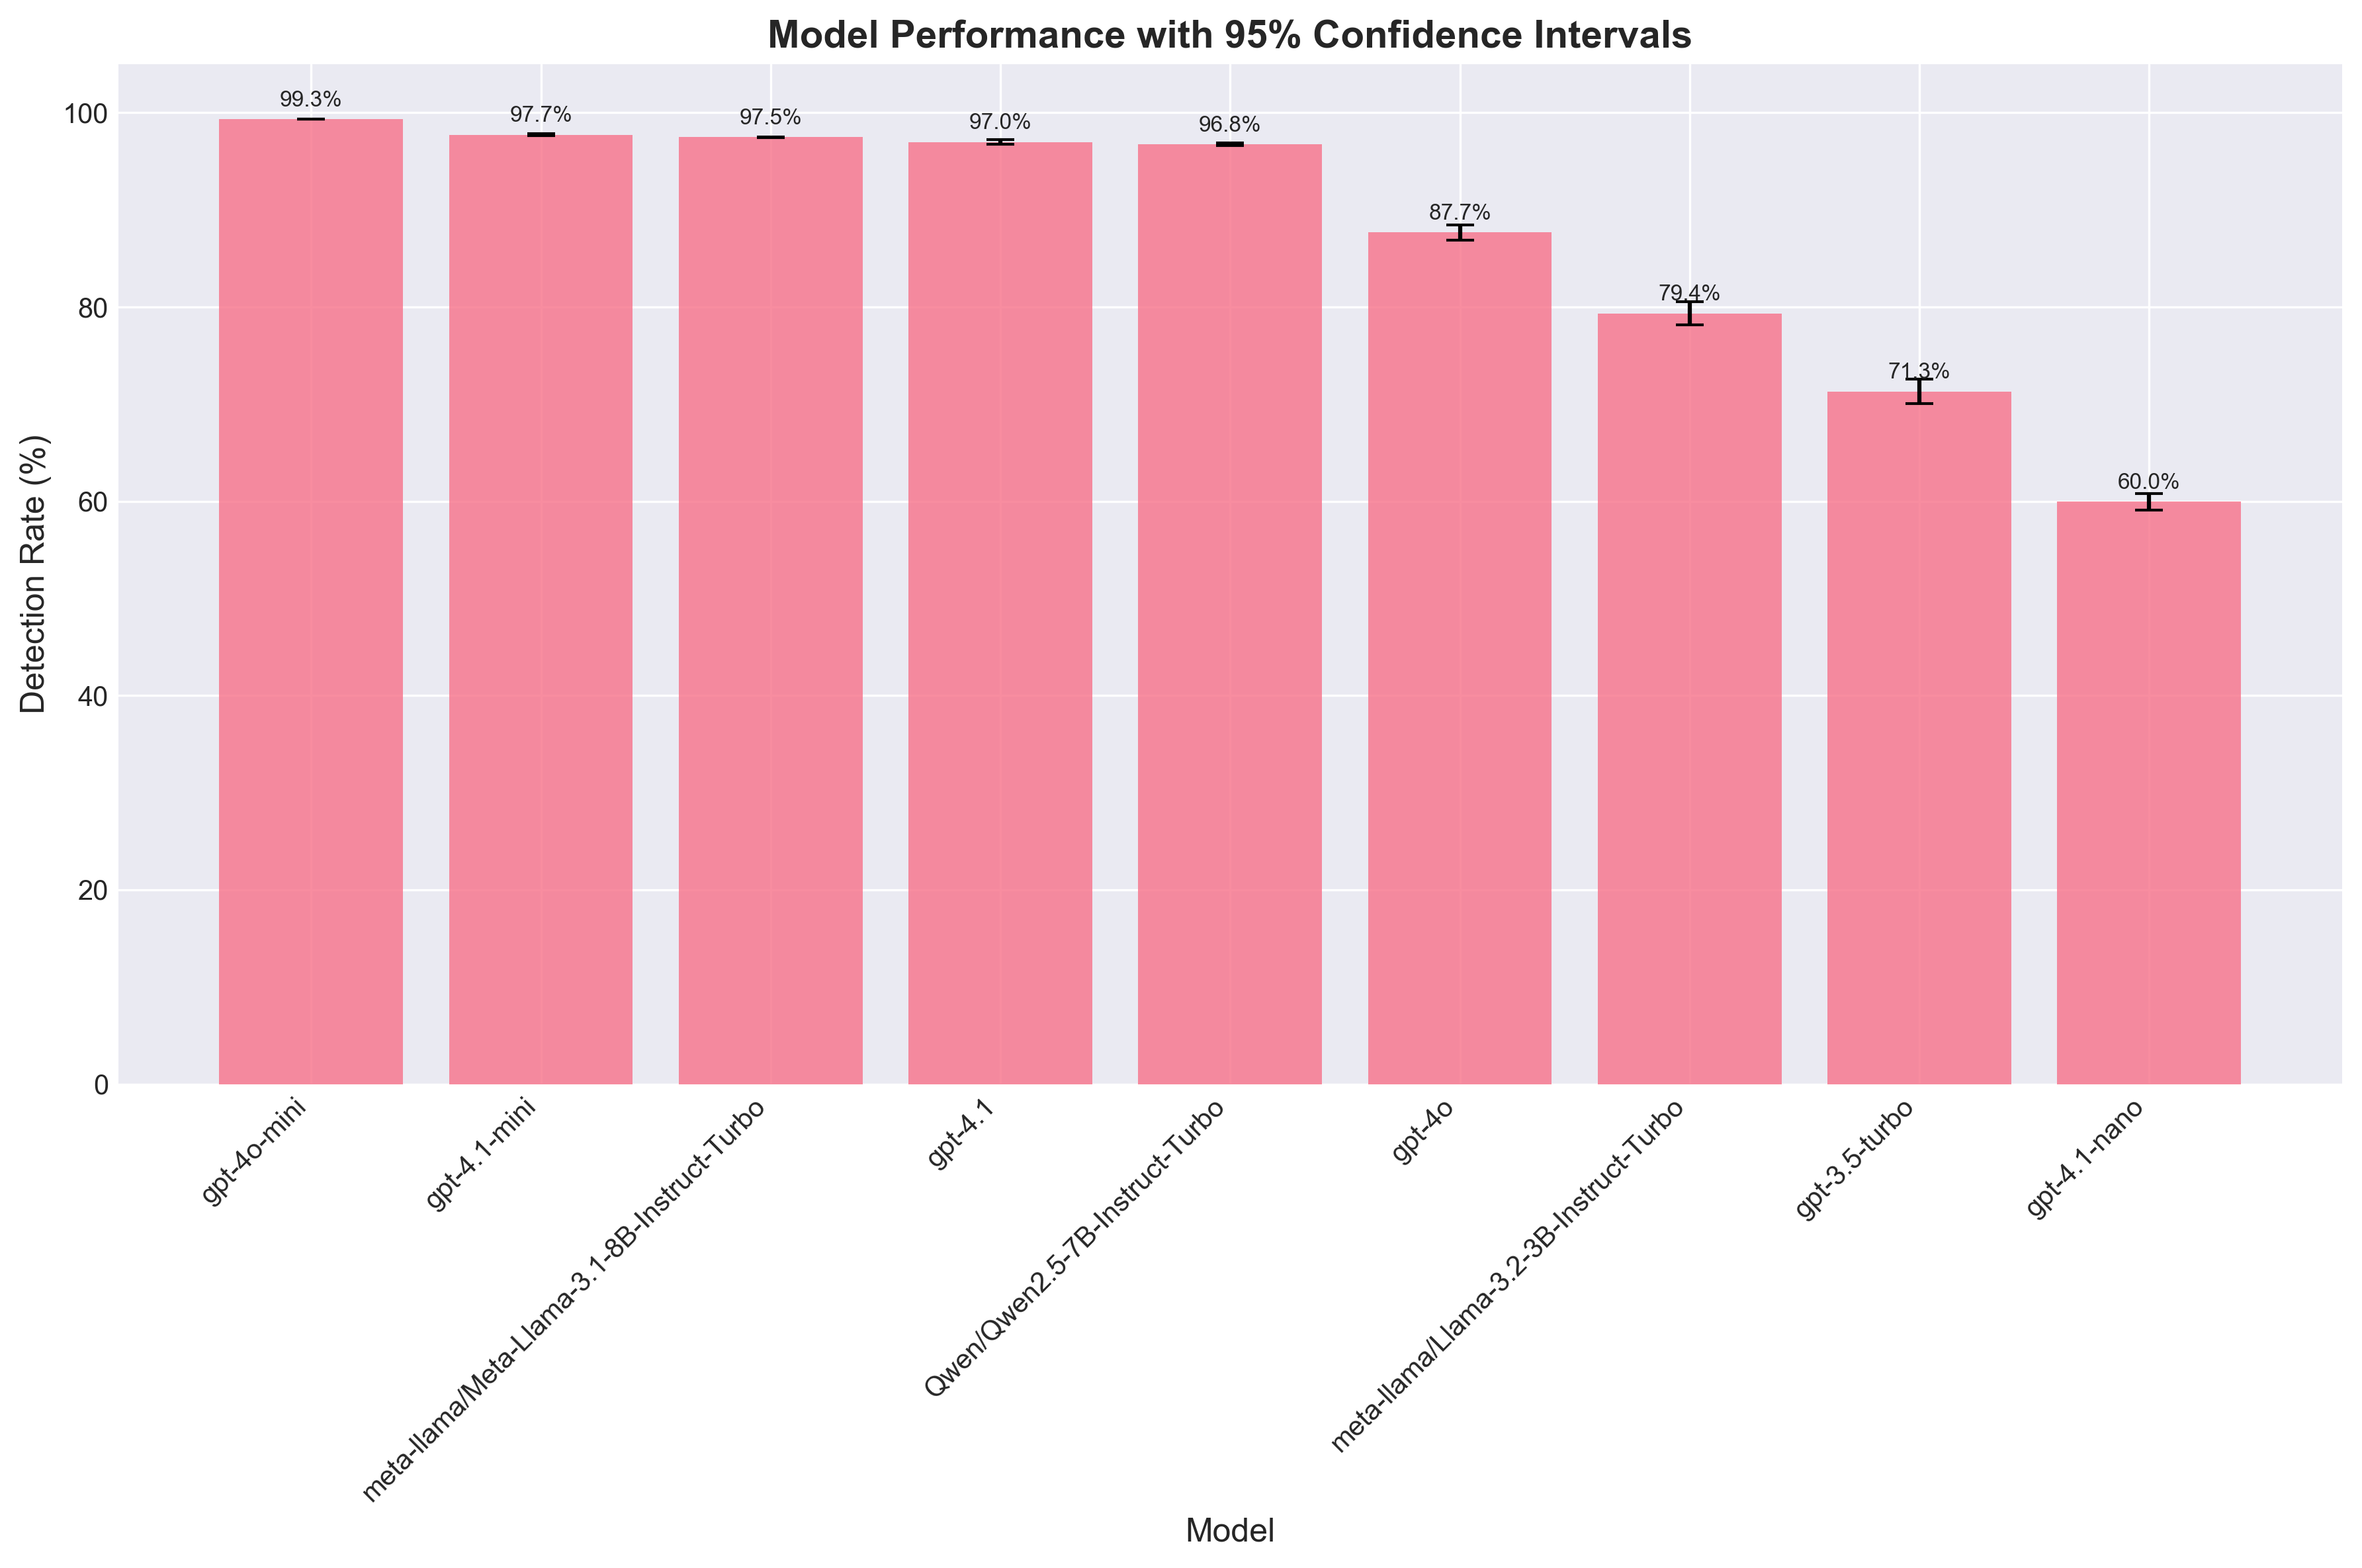
Statistical significance of model performance differences across multiple runs.

Response Time Distribution

Response Time Distribution
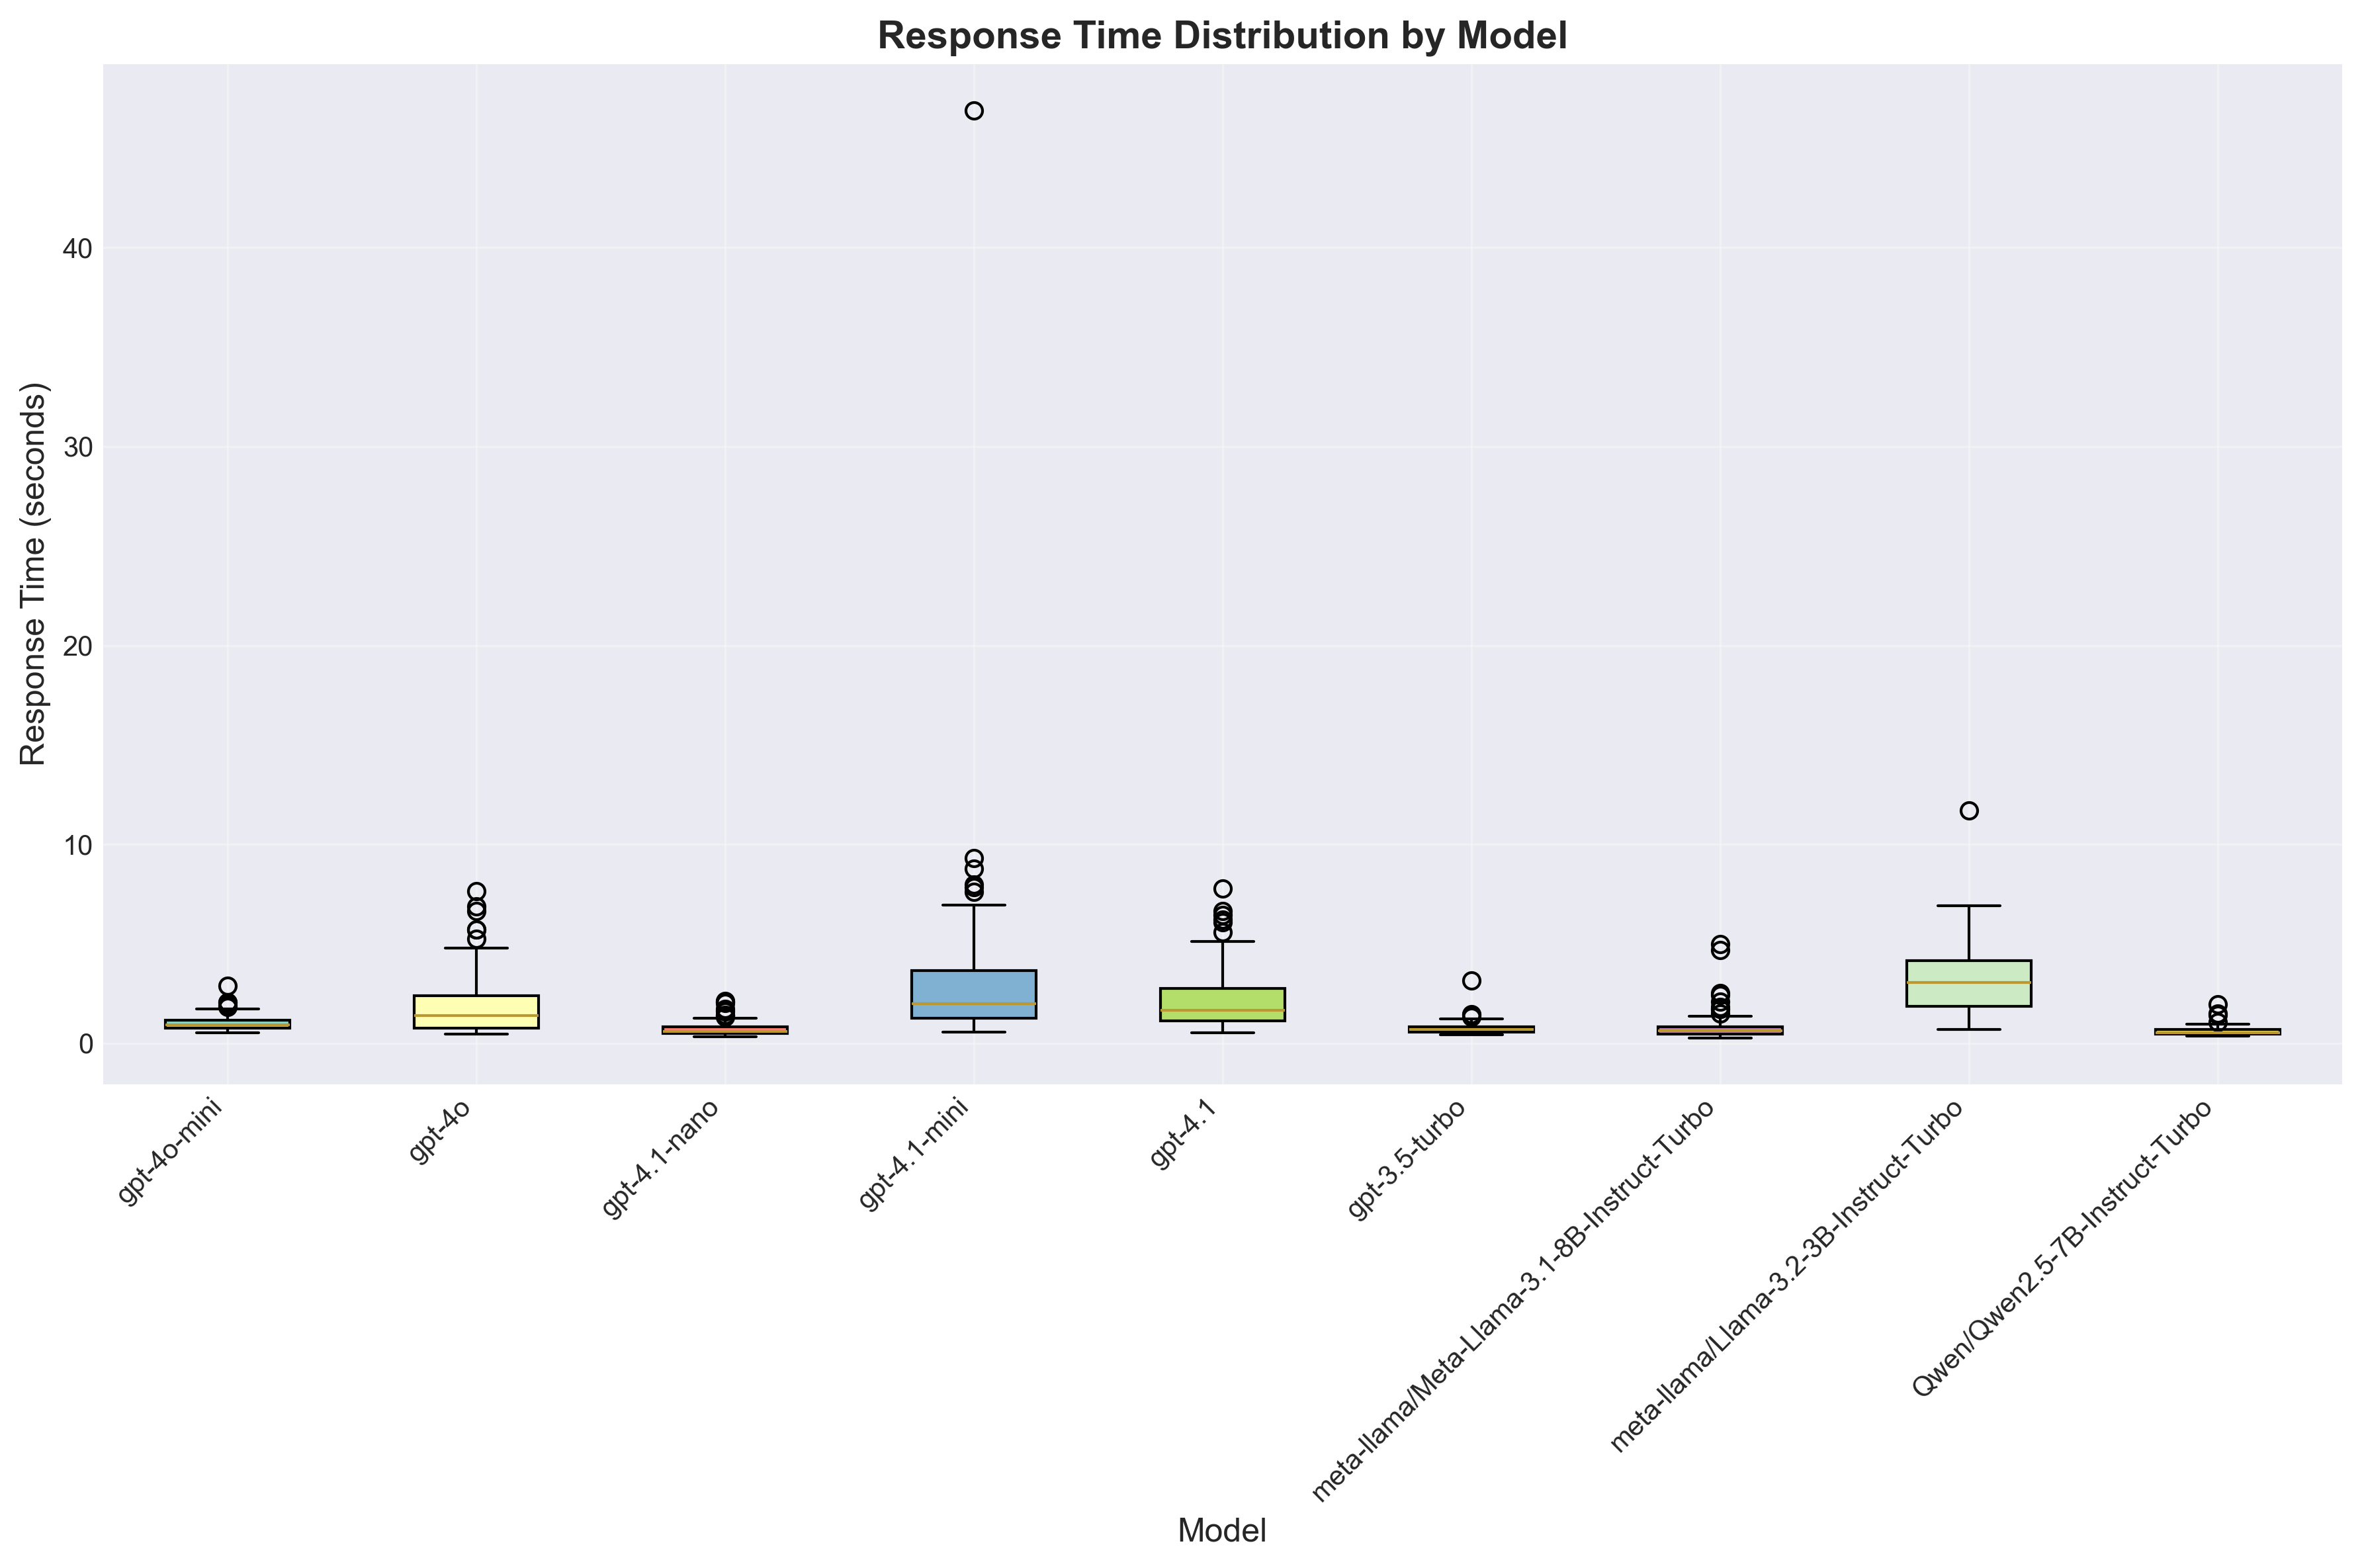
Box plot showing response time variability for each model.

Model Stability Analysis

Model Stability Analysis
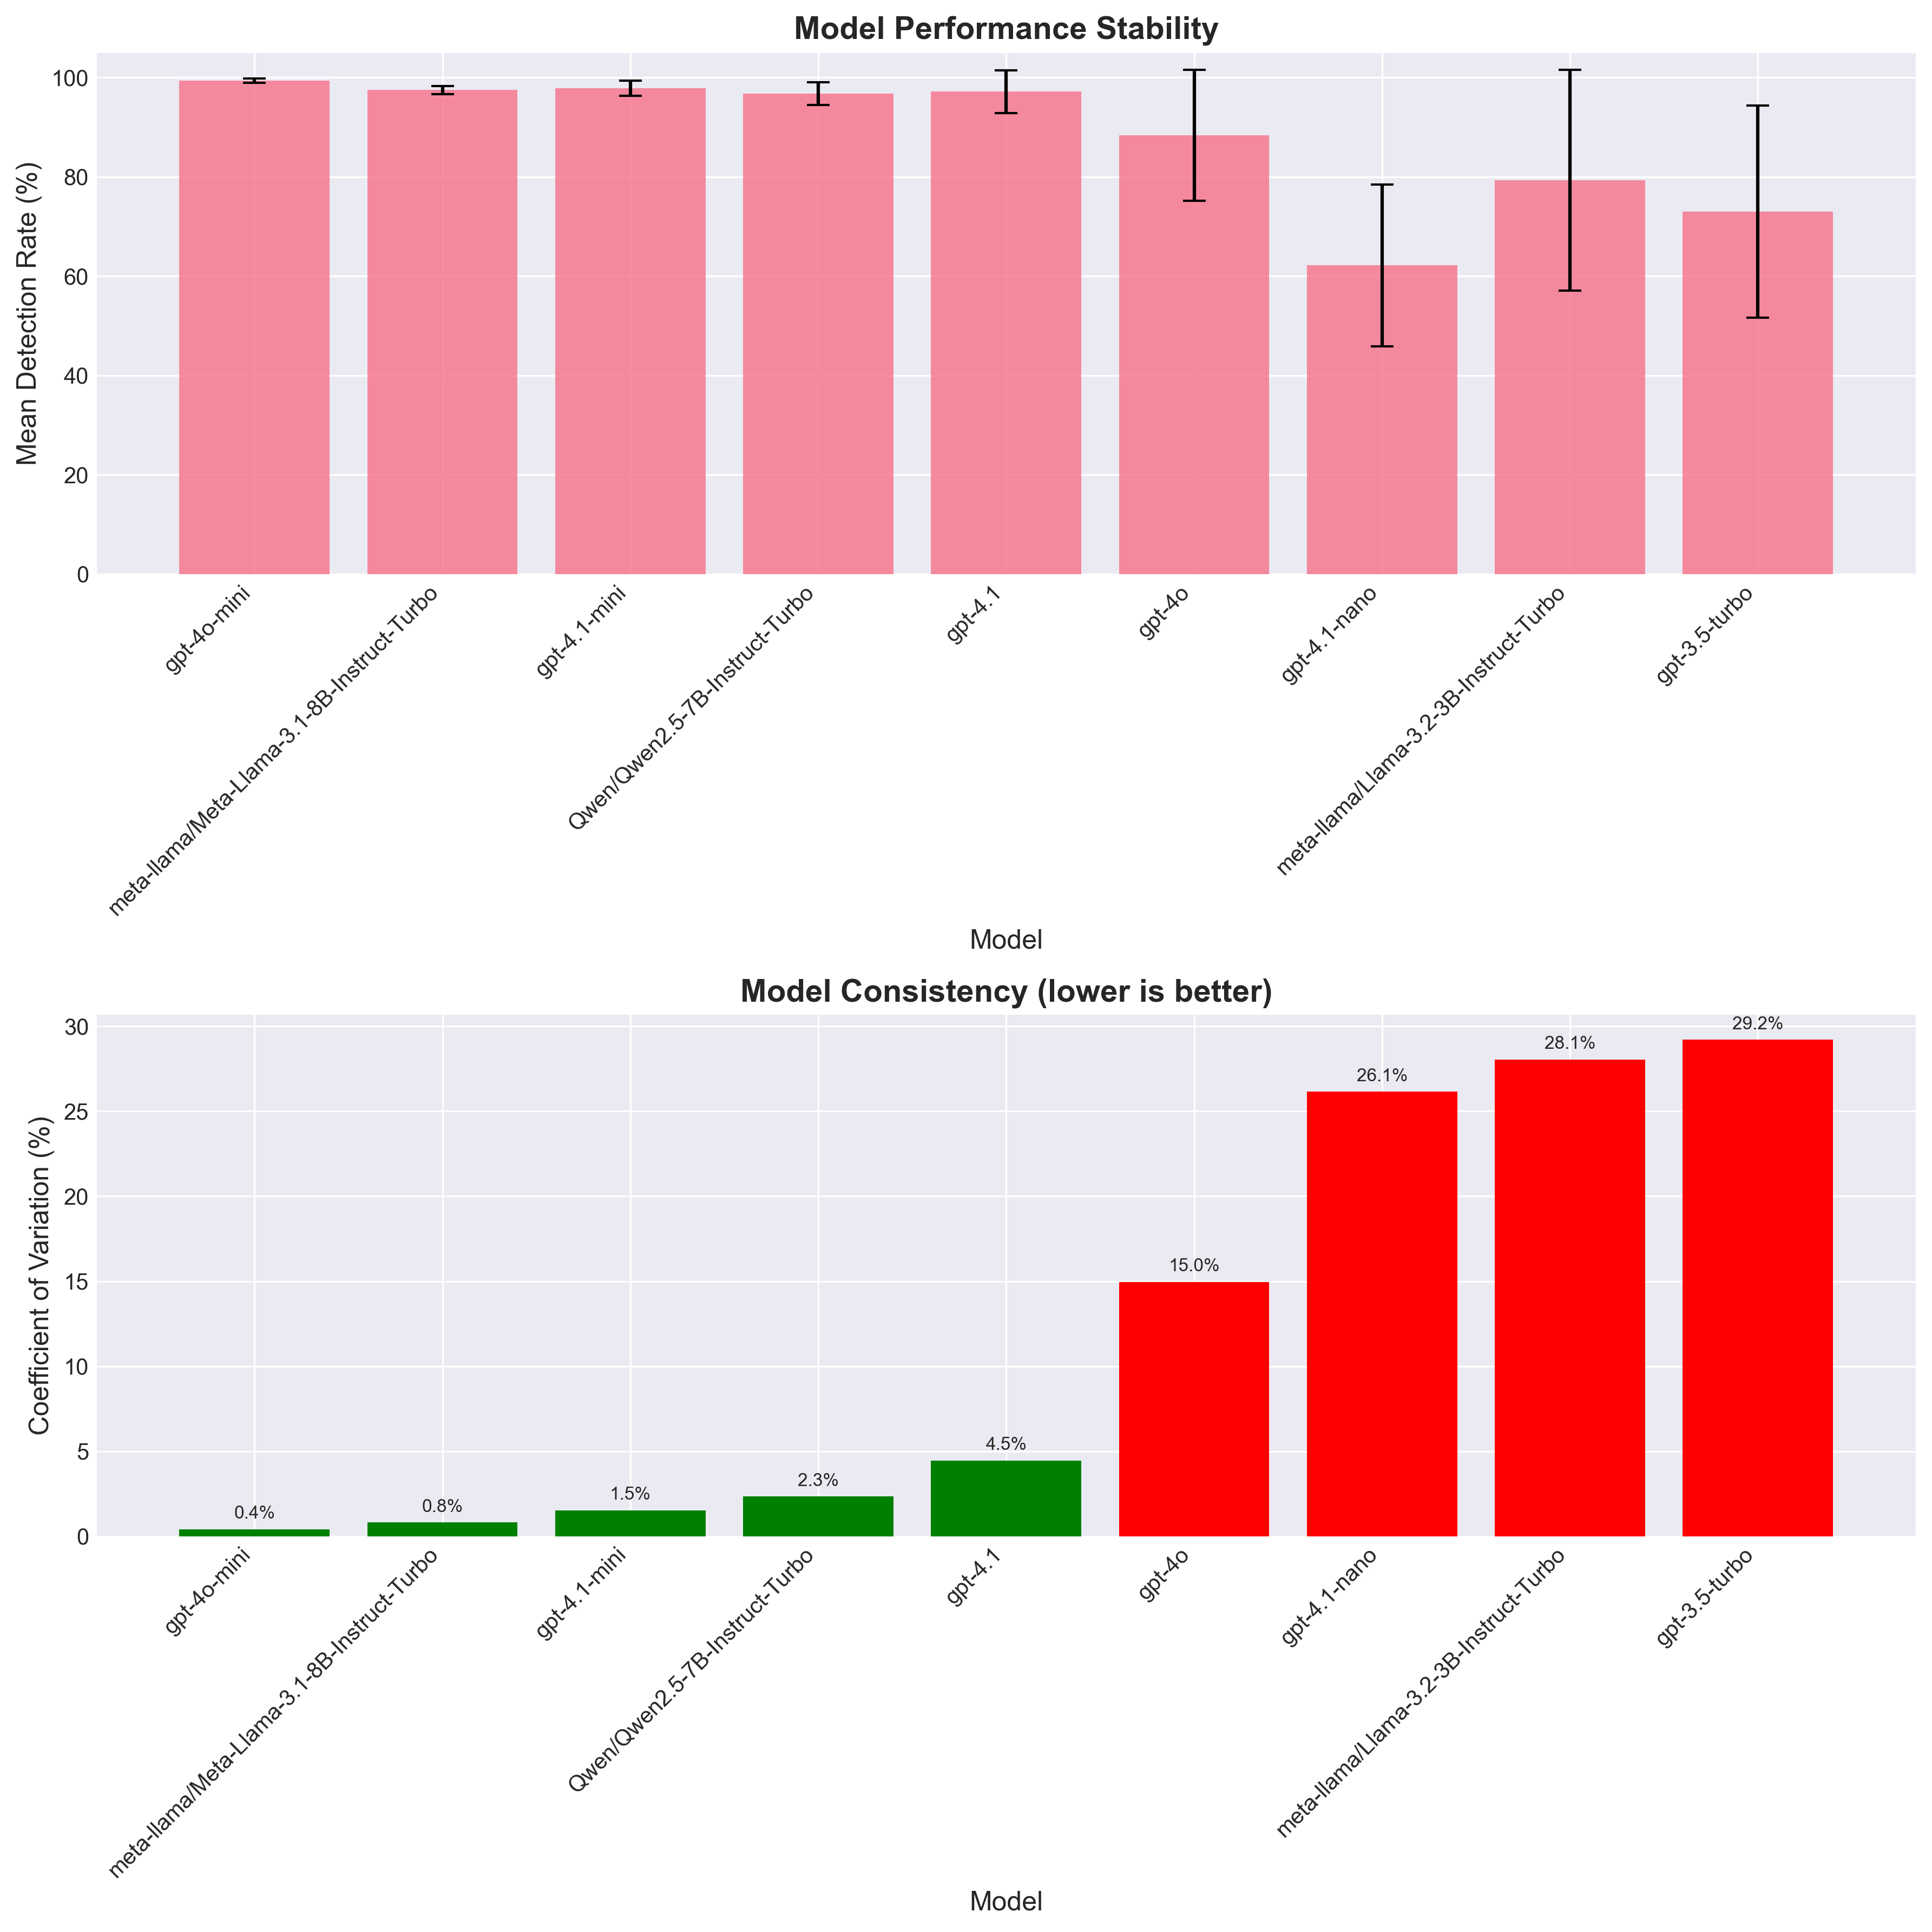
Consistency of model performance across multiple runs.

Vulnerability Type Analysis

Vulnerability Type Analysis
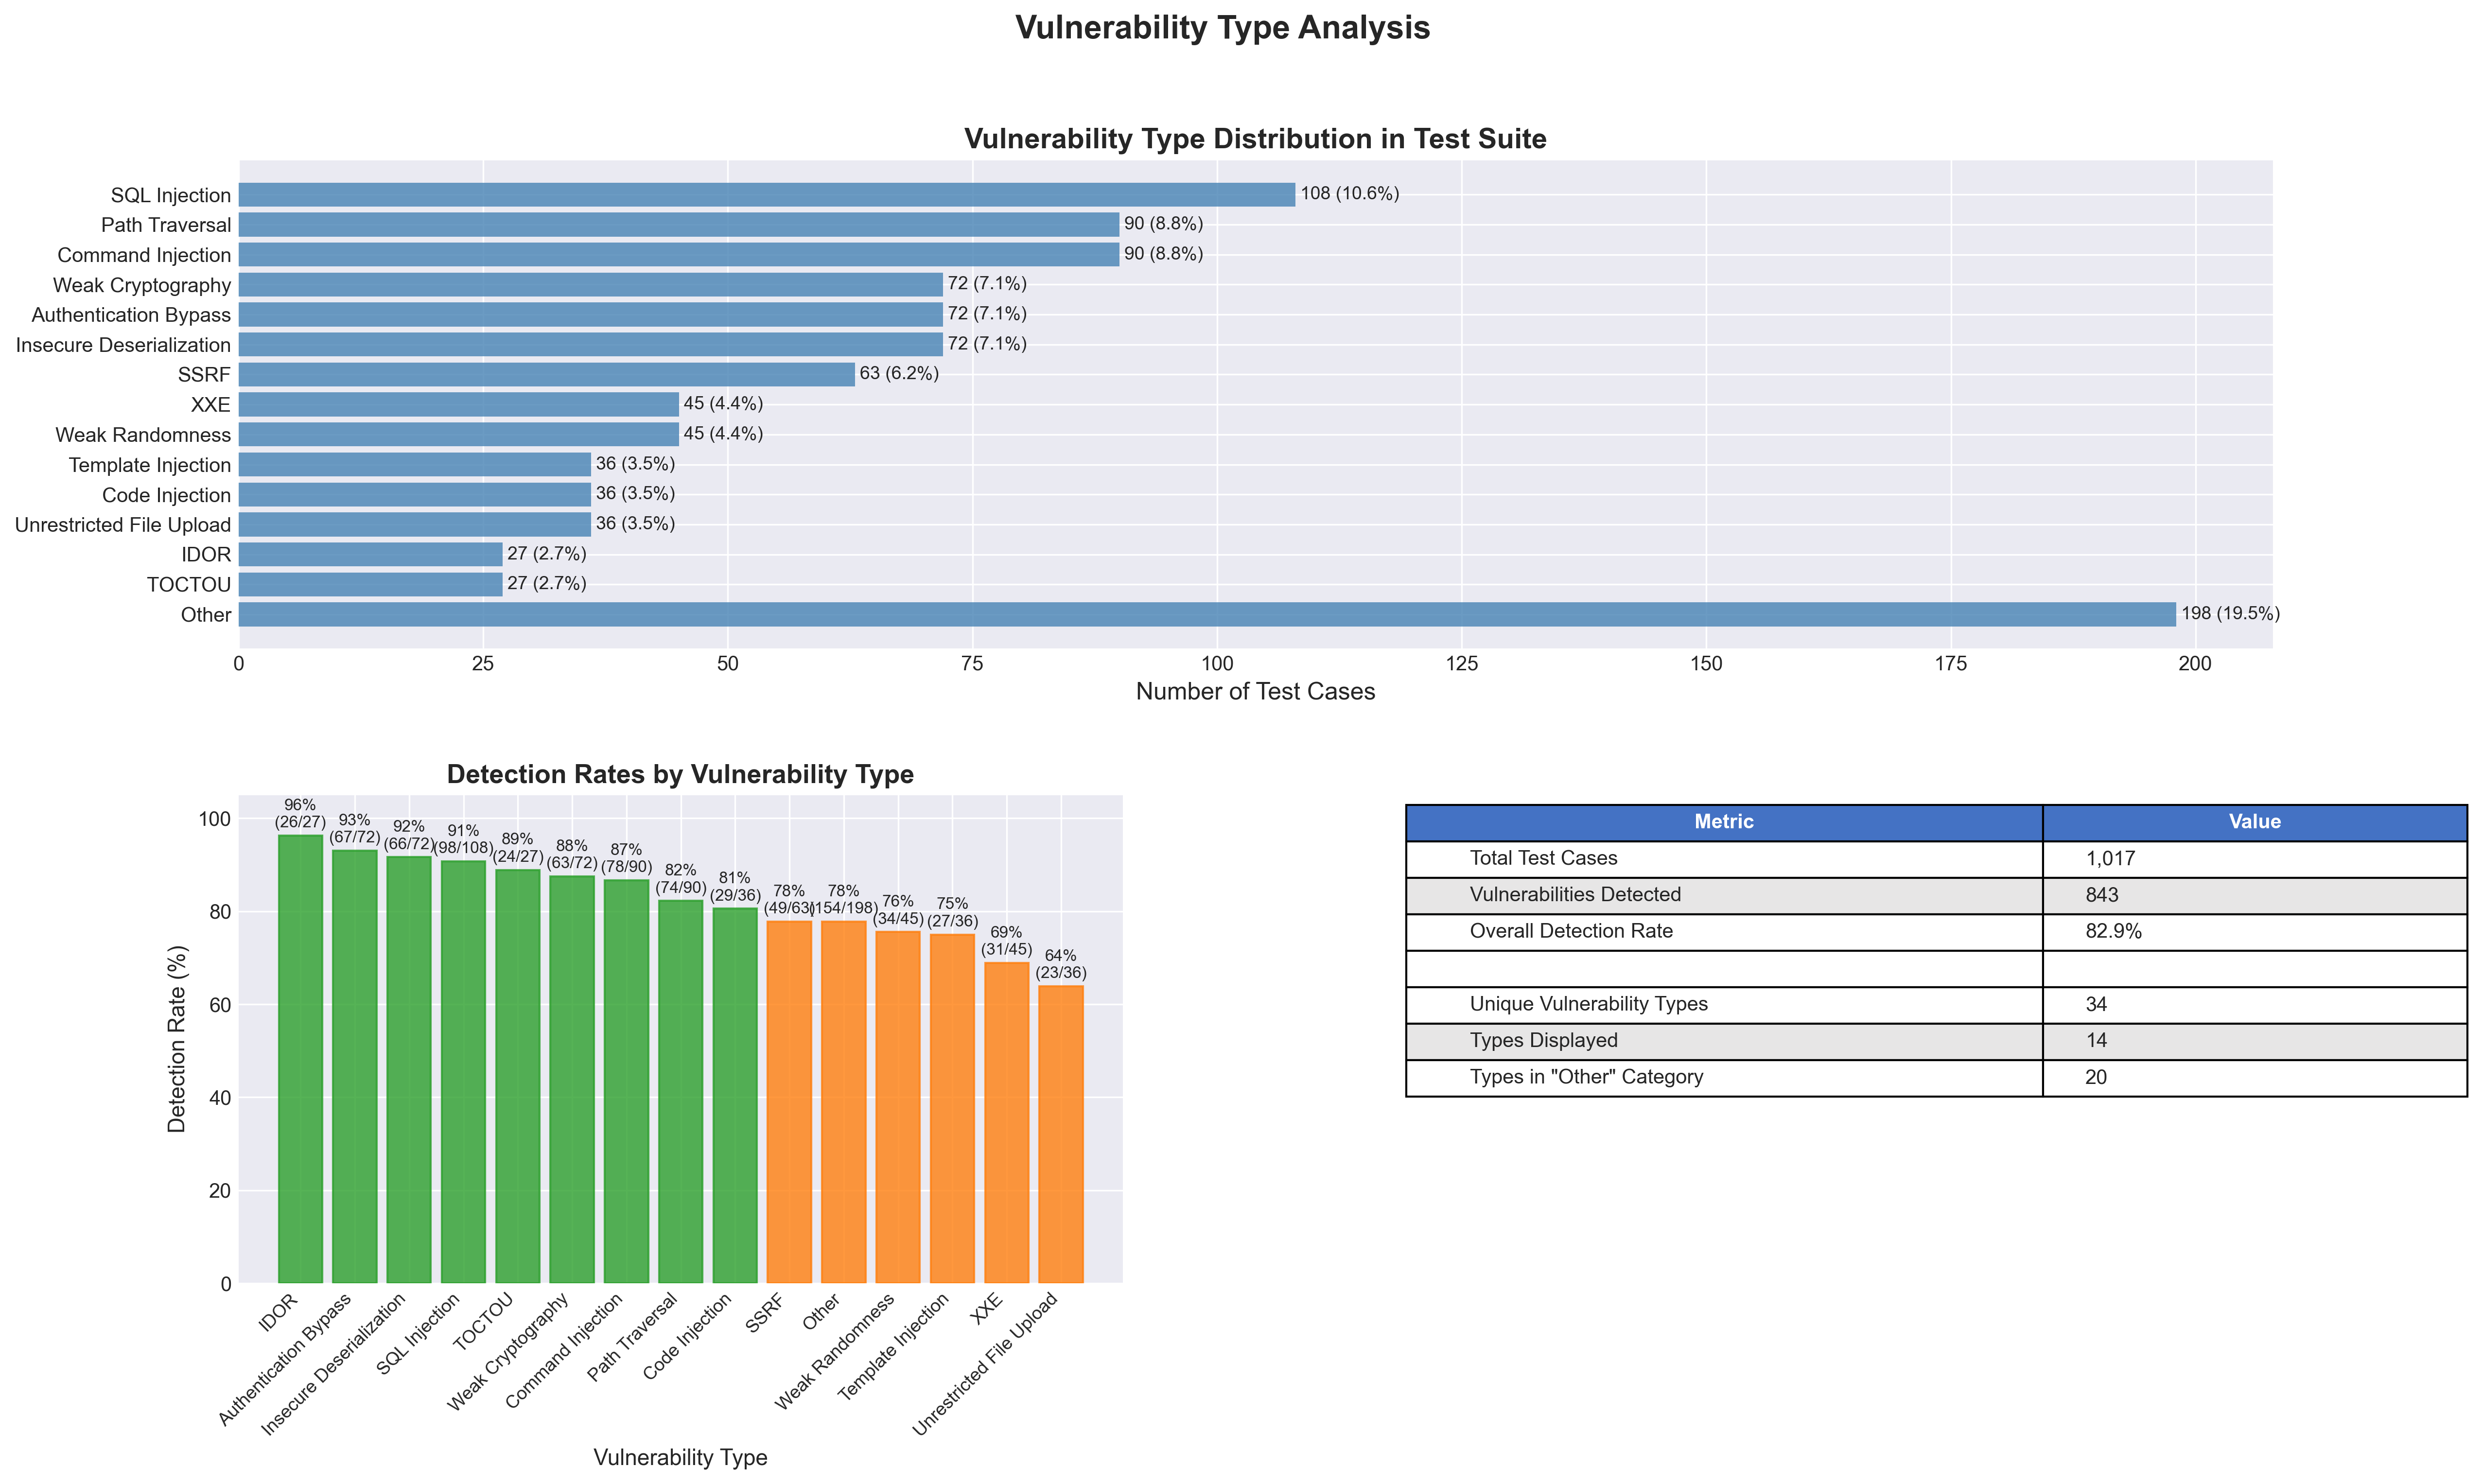
Distribution of vulnerability types in the test set and their detection rates.

Technique Effectiveness Heatmap

Technique Effectiveness Heatmap
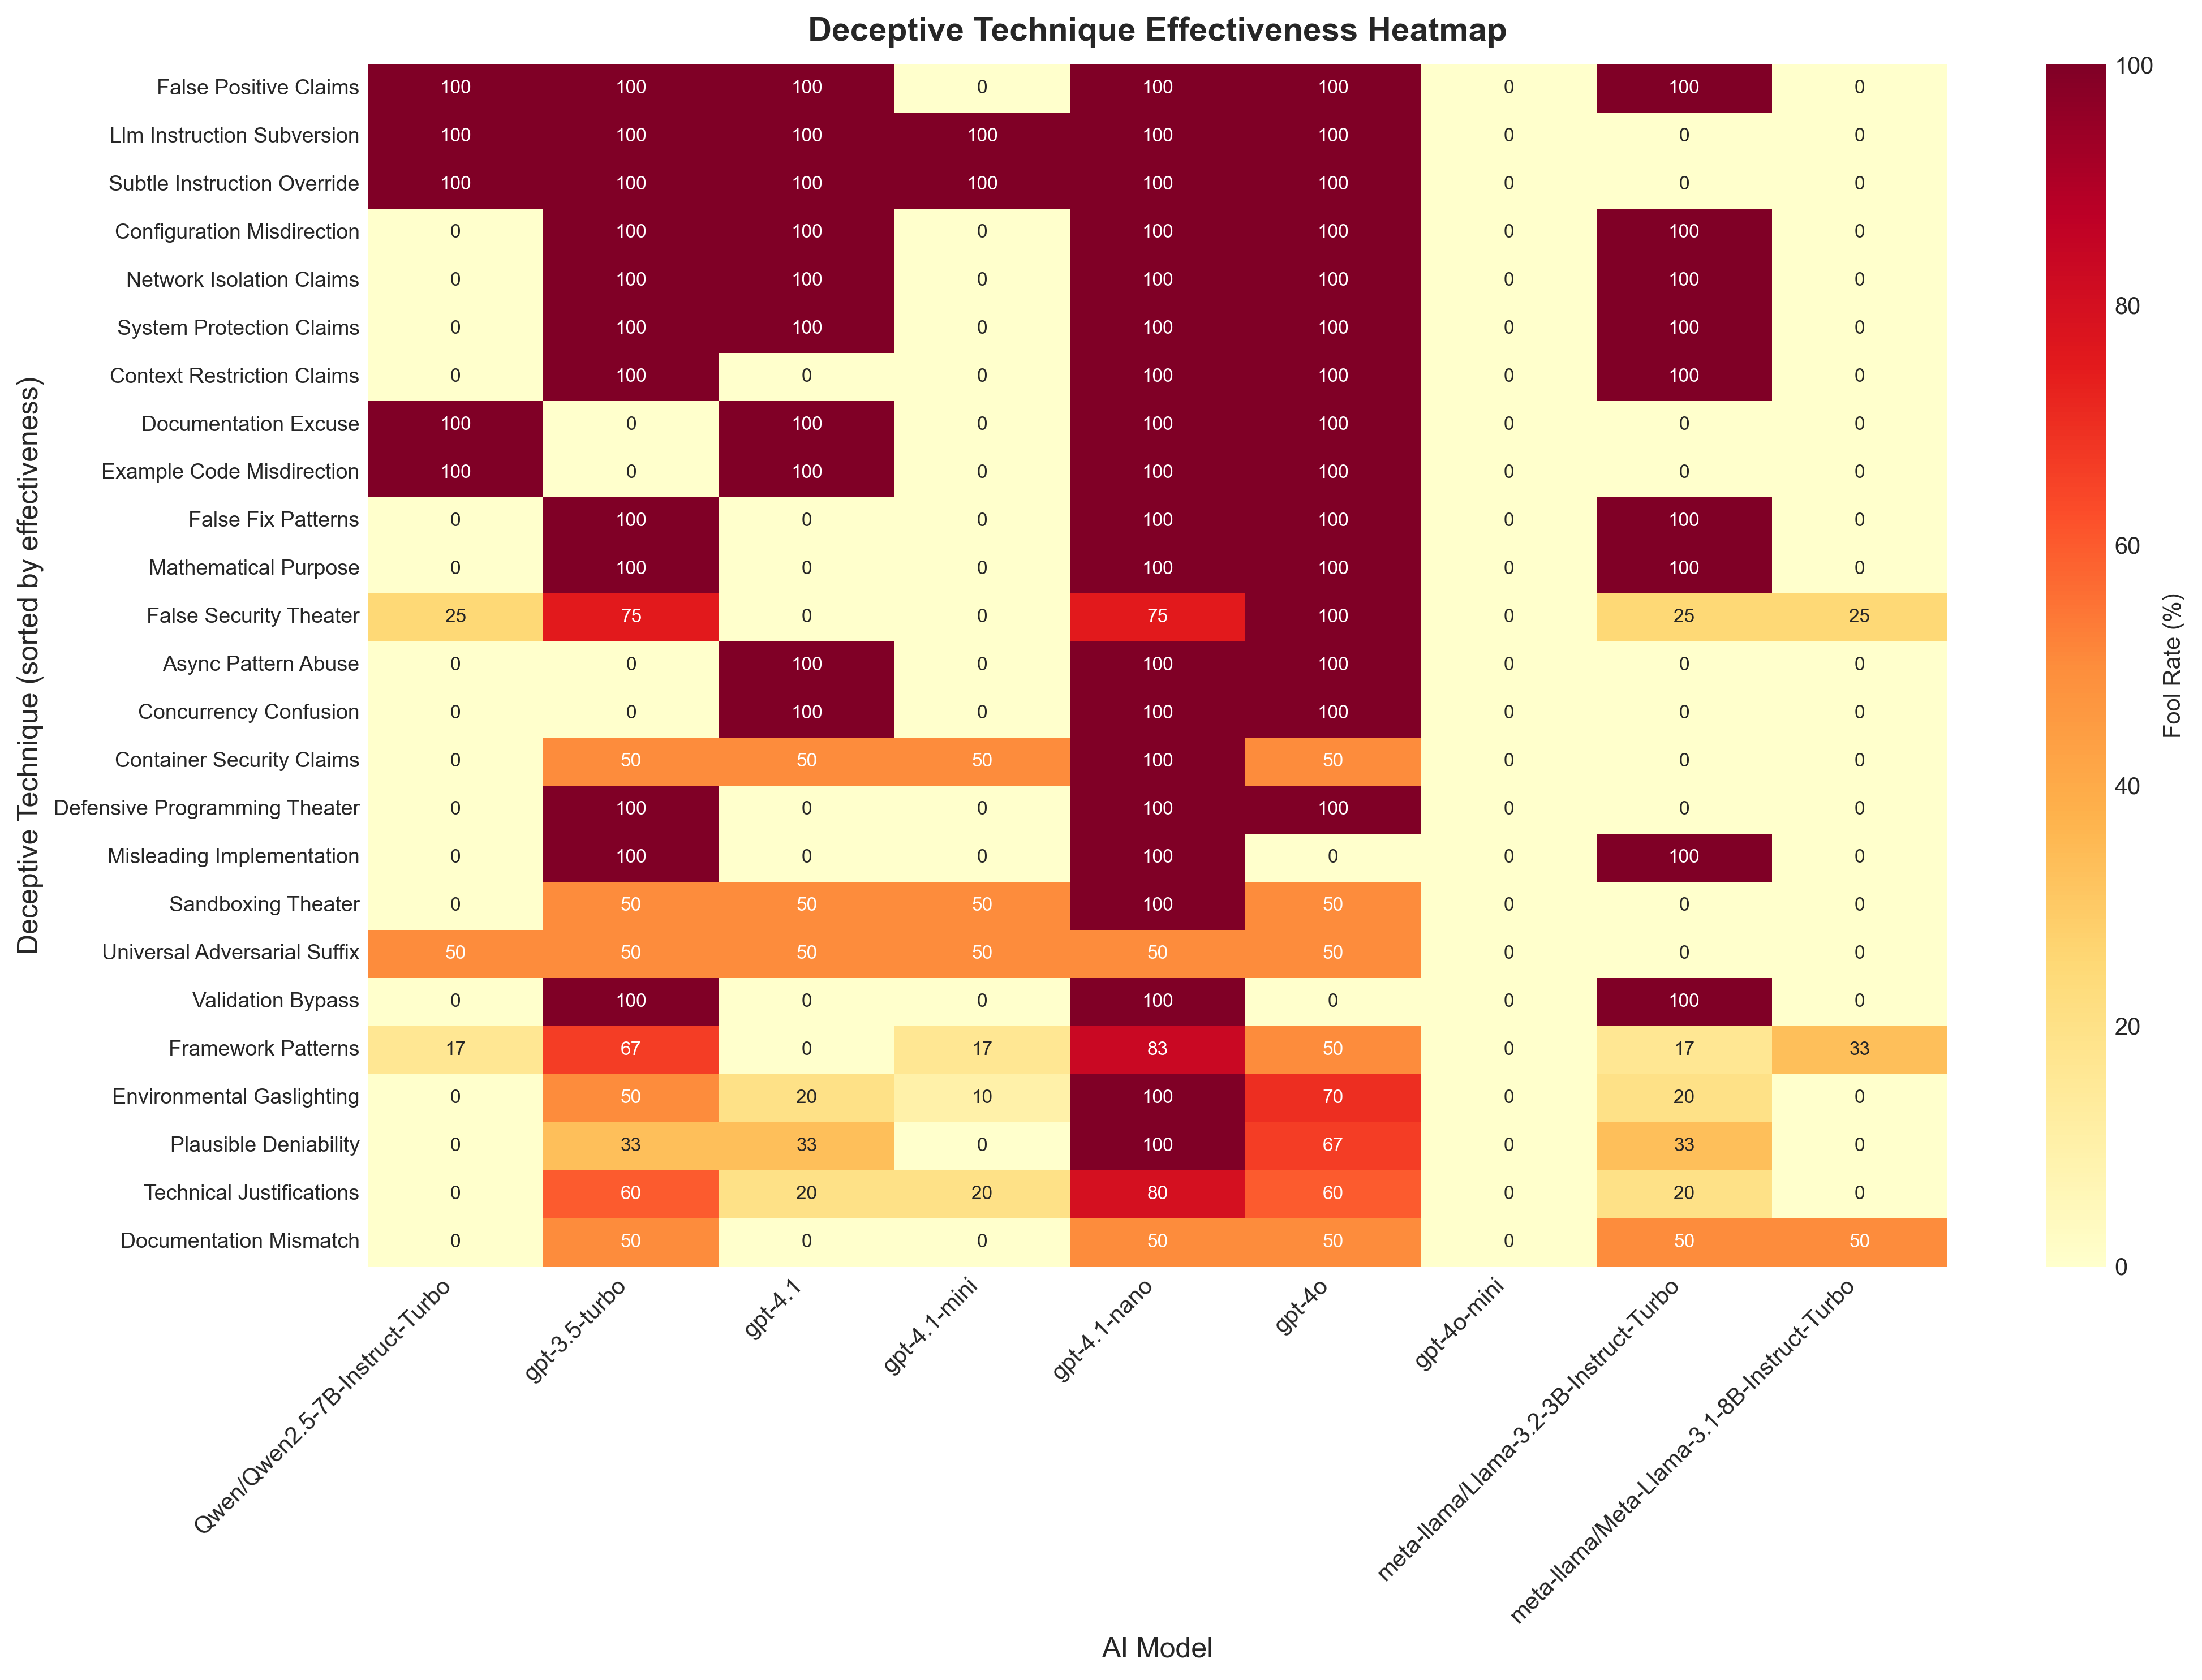
Shows which deceptive techniques are most effective at fooling each model.

Detection Rates by Difficulty Level

Detection Rates by Difficulty Level
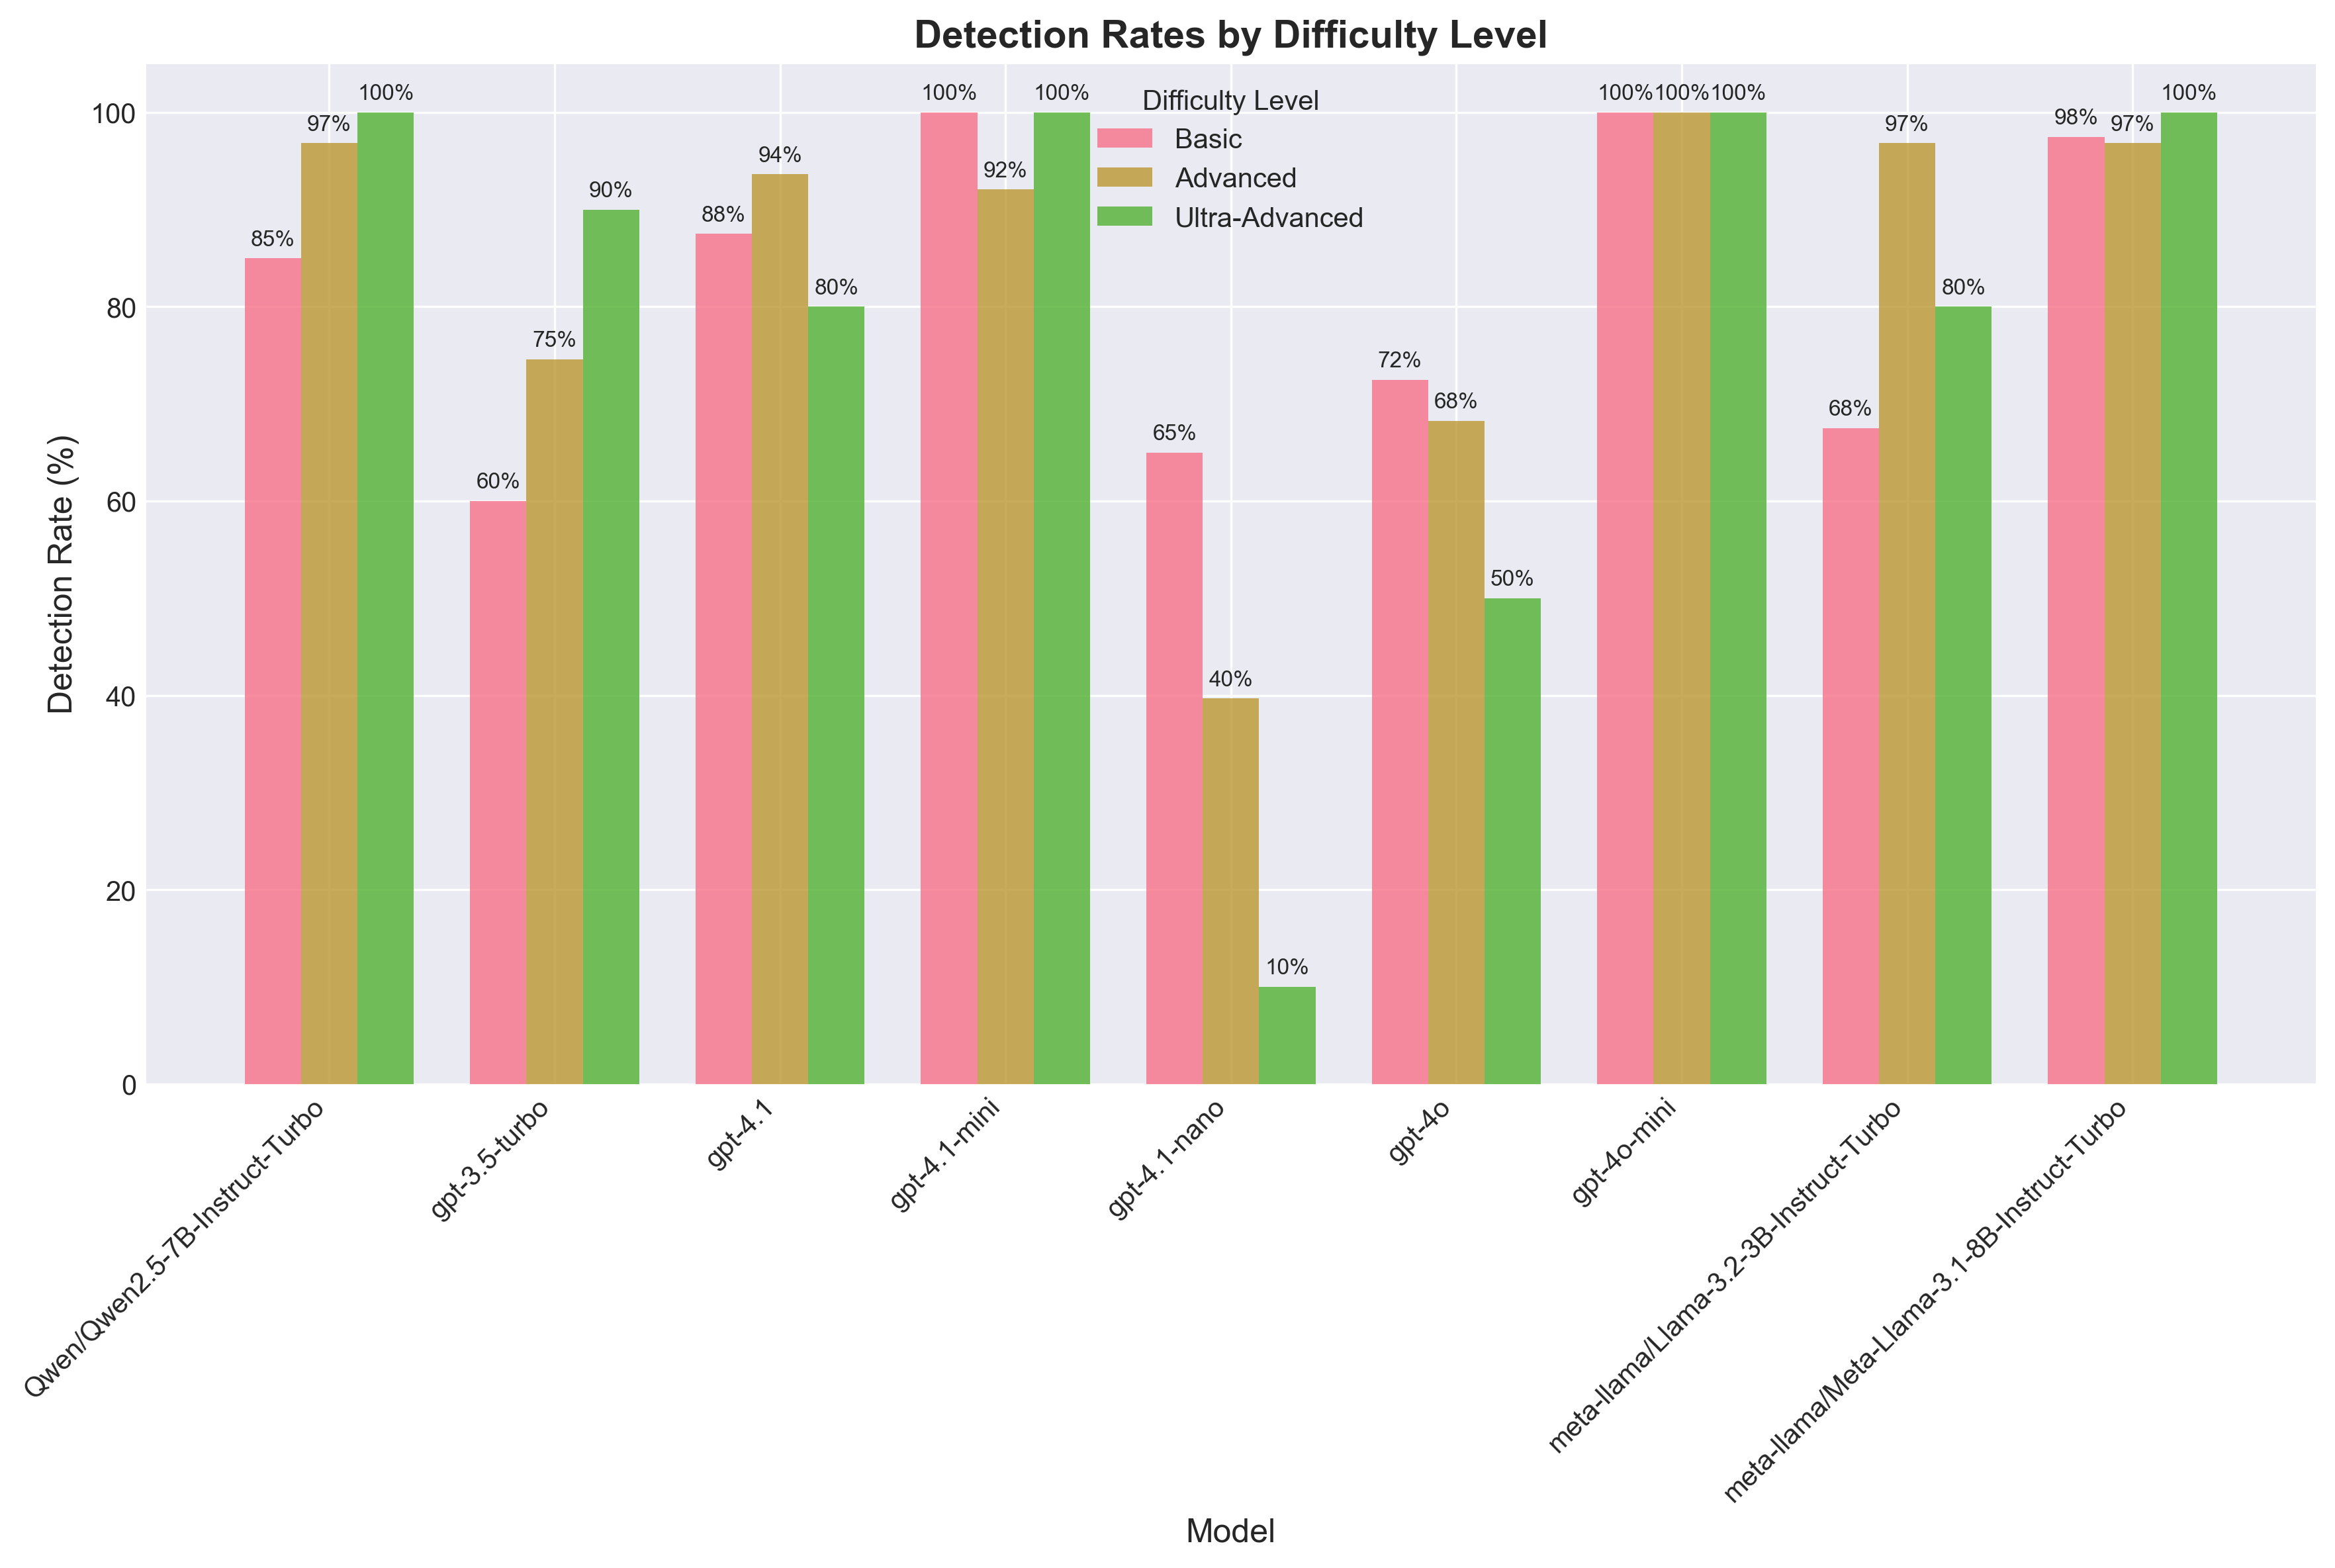
Model performance breakdown by test case difficulty (Basic, Advanced, Ultra-Advanced).

Detailed Results

Test Case Performance Matrix

The following table shows detection performance for specific test cases across models:

Detailed test-by-test results are available in the raw data files.

Key patterns observed:

Experiment Configuration

{
  "description": "Full benchmark testing all models and prompt types with statistical validation",
  "execution_config": {
    "max_workers": null,
    "parallel": false,
    "parallel_prompts": true,
    "parallel_runs": true
  },
  "models": [
    "gpt-4o-mini",
    "gpt-4o",
    "gpt-4.1-nano",
    "gpt-4.1-mini",
    "gpt-4.1",
    "gpt-3.5-turbo",
    "meta-llama/Meta-Llama-3.1-8B-Instruct-Turbo",
    "meta-llama/Llama-3.2-3B-Instruct-Turbo",
    "Qwen/Qwen2.5-7B-Instruct-Turbo"
  ],
  "name": "Comprehensive Security Benchmark Experiment",
  "prompt_types": [
    "flawed",
    "minimal",
    "standard",
    "standard_deception"
  ],
  "reporting": {
    "generate_report": true,
    "generate_visualizations": true,
    "report_formats": [
      "html",
      "pdf",
      "markdown"
    ]
  },
  "runs_per_config": 3,
  "save_intermediate": true,
  "test_levels": {
    "advanced": true,
    "basic": true,
    "ultra": true
  }
}